Using the BBTK pressure sensitive force activated USB response pad: Worked example

 A wide variety of researchers could benefit by collecting force data, or pressure sensitive data, in addition to more traditional reaction time measures, e.g. neuroscientists, cognitive psychologists, vision researchers etc.
We appreciate that many may have used basic RT measures, but very few have currently used force data that tells them how hard a participant pressed a response button. This value-added data tells you much more than how hard a button was pressed however. For example, it can tell you if there was any preresponse activity, the impact of preresponse cuing, whether cues effect reaction times and force curves, the certainty or uncertainty behind the RT and more. Show Me
Worked example
Shown below is a simple worked example illustrating how to use the pressure sensitive force activated USB response pad. It is intended to give you a flavor of how the PSURP could work for you and how easy it is to use.Step 1: Running your experiment, presenting stimuli and collecting responses
The schematic below shows a simple EEG study and how the PSURP is connected to the STIM PC you present stimuli to the participant on. Two USB leads connect to the STIM PC, one for a keyboard HID (orange line) and another for streaming serial force data to our partner App (second orange line). The partner App interacts with your STIM PC and with the PSURP itself and acts as the glue holding the whole experiment together (two yellow lines). It records Real Time Clock timestamps from your PC at the same time your experiment records Response Times from the keystrokes the PSURP sends once a given force threshold is passed.An Event Marking line, or cable, is connected to the EEG System Unit (red) so that a +5V TTL signal will appear on the STIM TTL Trigger Input port and ultimately on the EEG Event Marking channels when a button force threshold is surpassed. This event mark will correspond with when the USB keyboard keystroke is sent to your experiment. The TTL line tied to a given button will be active high whilst the force threshold you set is surpassed and the keystroke being held down. It will go off, or 0V, when the button is released.
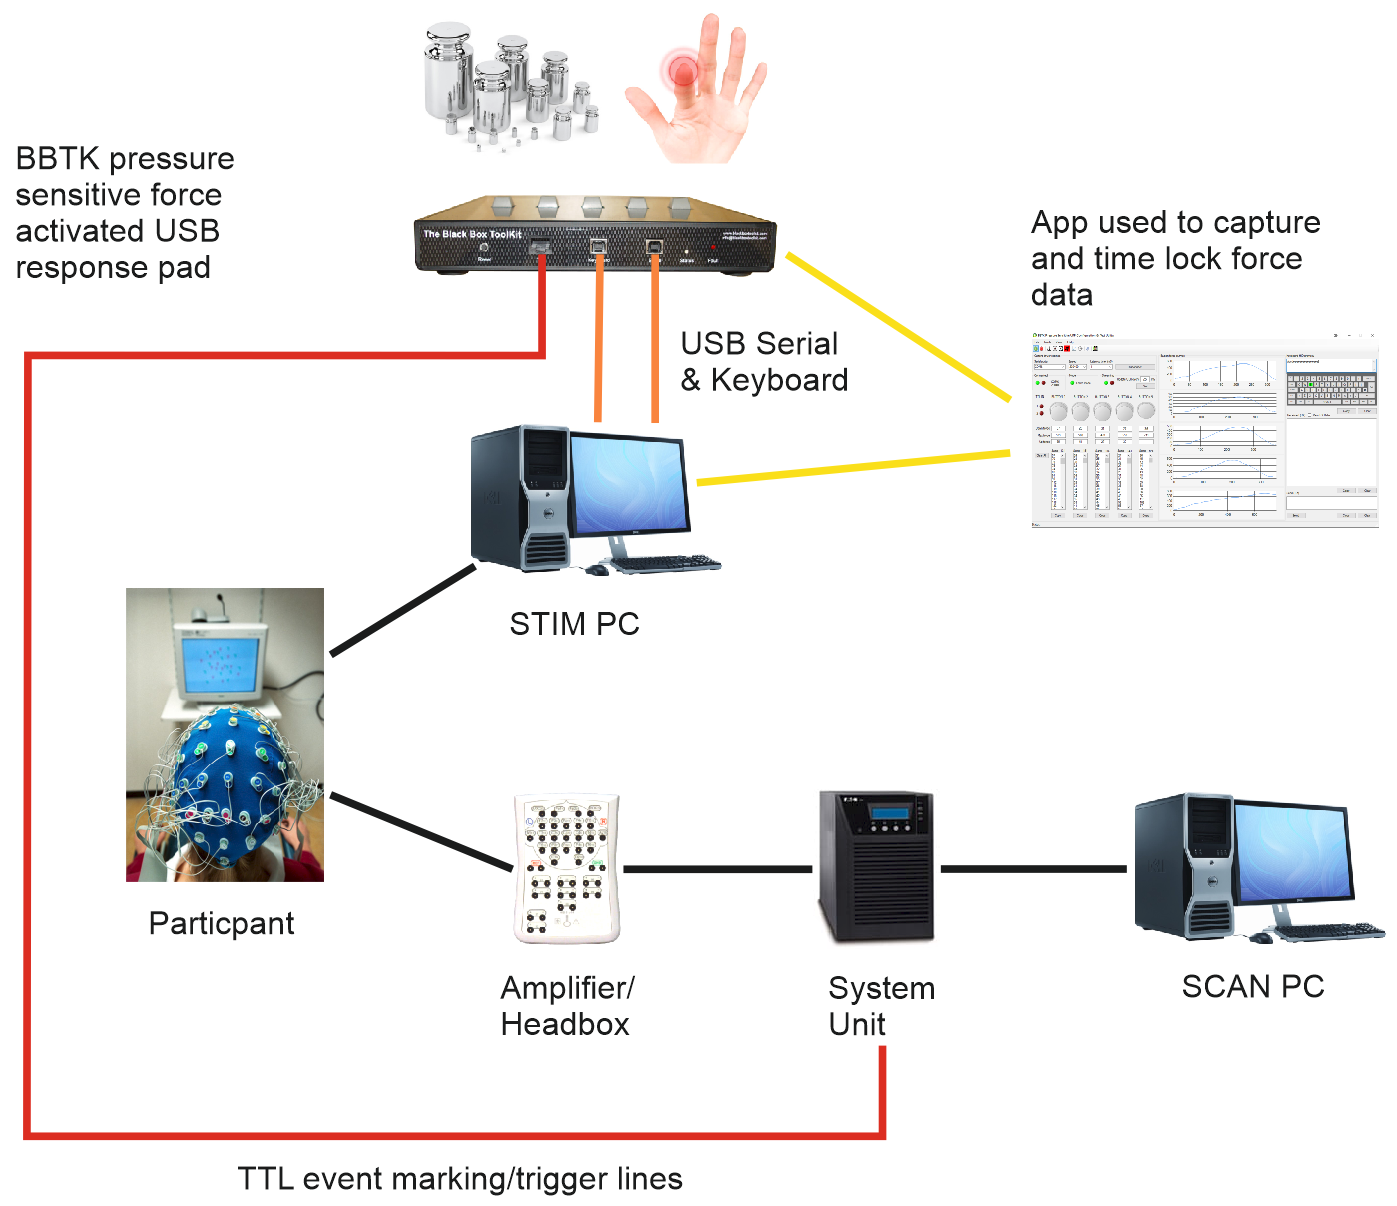
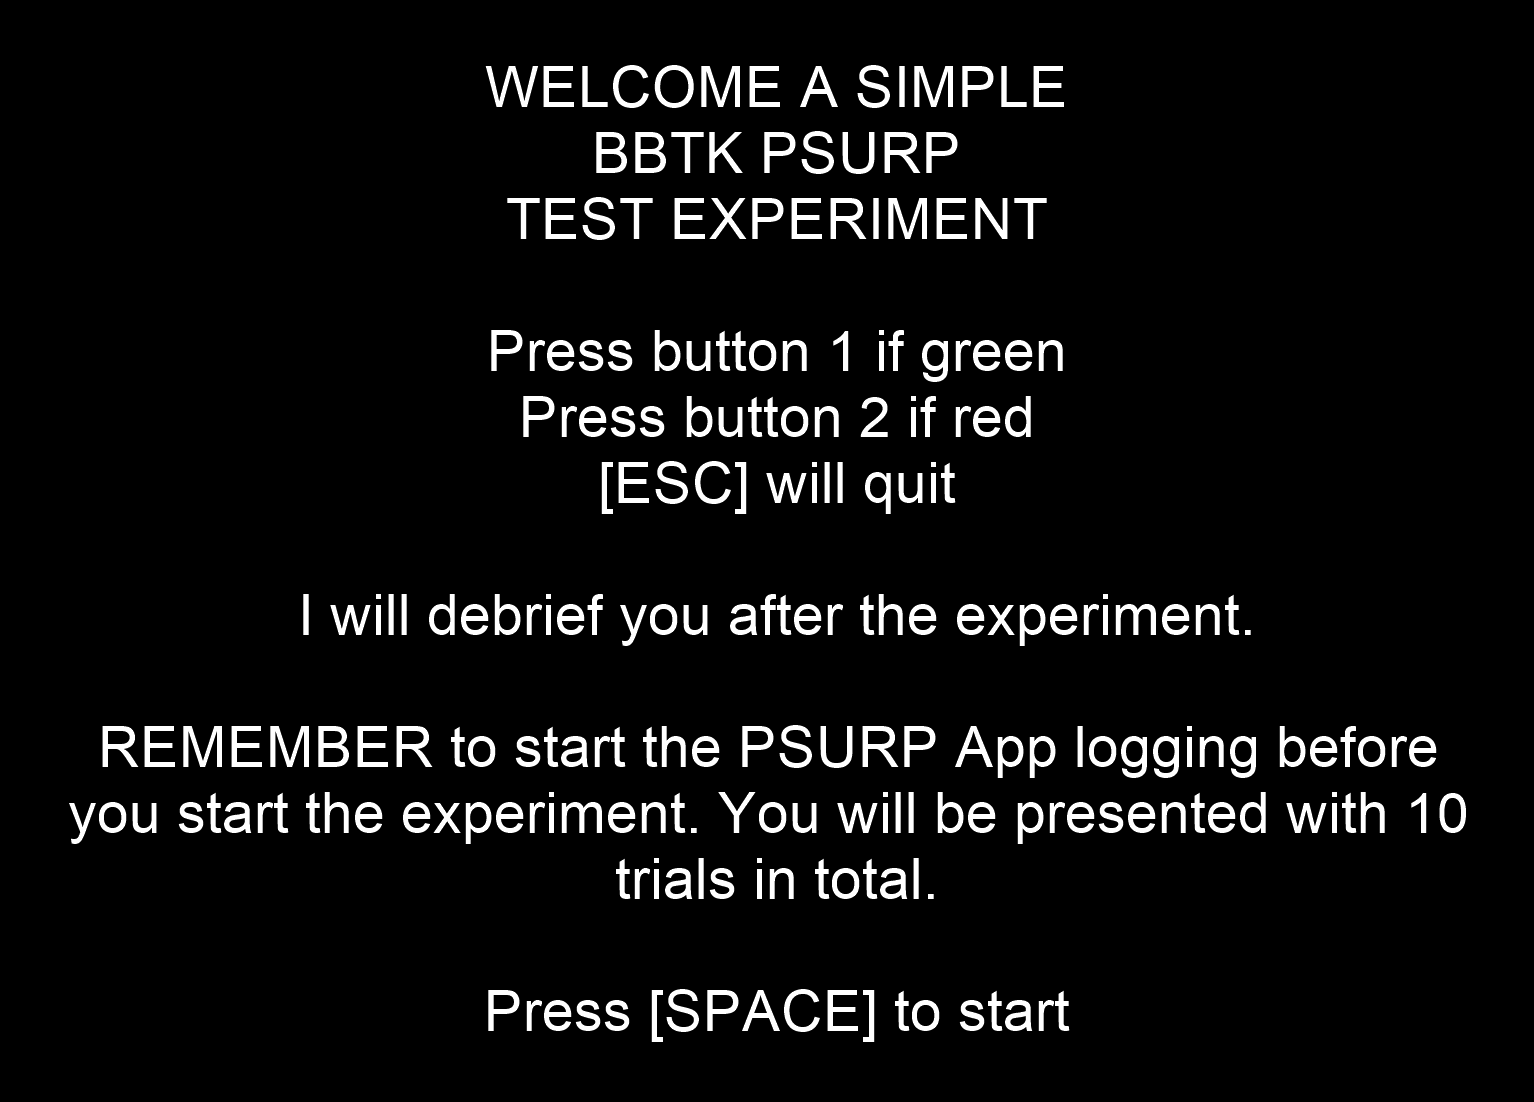
In this example the participant has to press button one when a green smiley face stimulus is shown on the STIM PC�s screen and button two when a red sad face is shown. Once a given force threshold has been surpassed either an �a� or a �b� USB keyboard keystroke will be produced depending on what button has been pressed. All the experiment sees are �a� or �b� keystrokes that are held down for a given duration.
Whilst the experiment is running the PSURP partner App is logging the Real Time Clock values at the same time as your experiment so that they can be time locked afterwards and pressure force curves aligned with RT�s based on keystrokes. This means that your experiment can get on with its job and the PSURP and partner App can get on with theirs.
 |
|
 |
 |
Note on the stimulus images shown above there is a white Opto marker which can be detected by a BBTK v2 or mBBTK (event marking version). A TTL trigger from a BBTK or mBBTK v2 can be fed into the pressure sensitive force activated USB response pad RJ45 TTL port when the actual stimulus image is detected as being shown in the real world. This TTL event mark is recorded by the partner App and streamed in the data. A second TTL trigger in allows for audio onsets or other TTL event marks, e.g. from your own scripts or hardware such as eye trackers.
 |
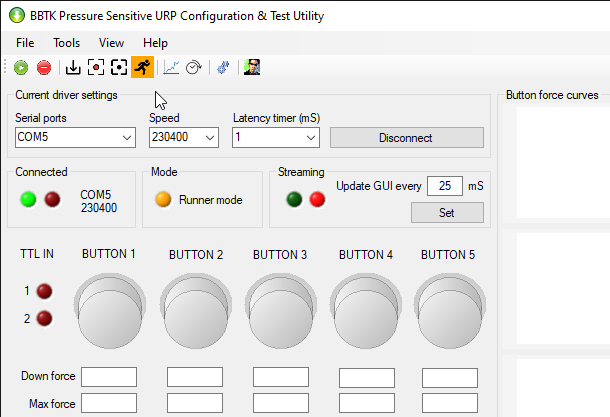 |
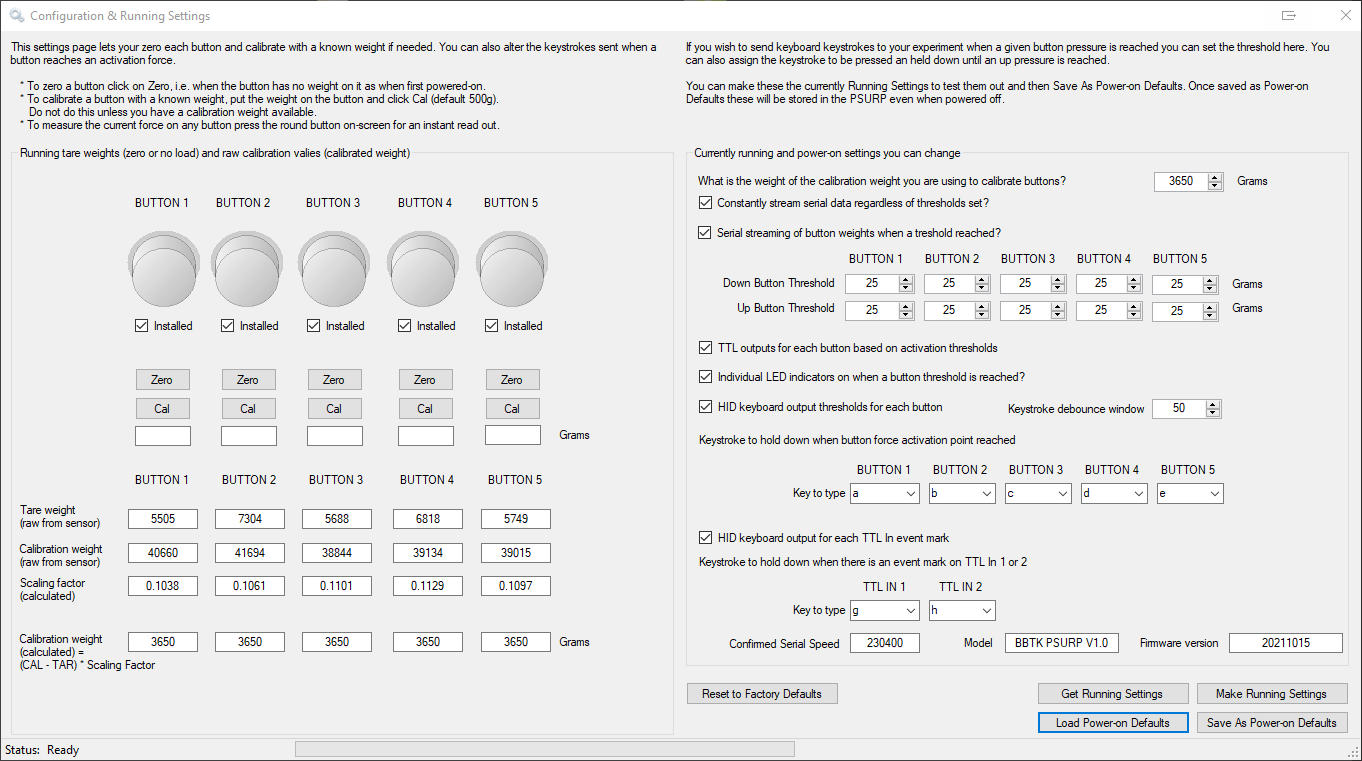
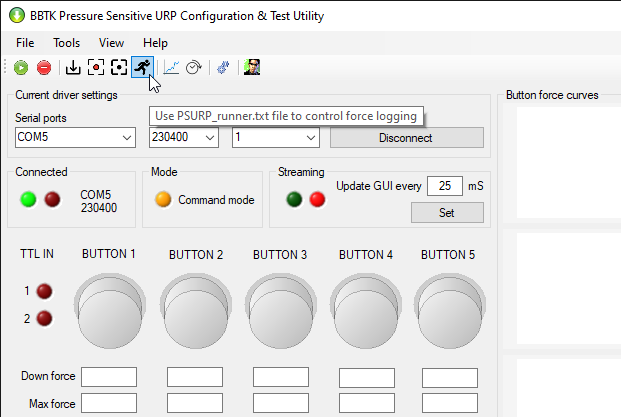
All you need do is make sure that our MS Windows based partner App is running and set to capture data whilst your experiment is running. Your own experiment selects which file to save the captured force and time stamped data to and whether to start and stop capturing data. Keystroke and threshold data are stored in the PSURP hardware and are maintained even when the PSRUP is not powered on.
Step 2: Checking individual force curves recorded by the pressure sensitive force activated USB response pad
Once your experiment has completed generally the first thing to check is the .PSL file (Pressure Sensitive Log) that the BBTK PSURP partner App has recorded. This is a pure text based CSV file that is read by the App and converted to a per button force plot and spreadsheet view. Each sample across up to 5 pressure sensitive buttons is timestamped and recorded on a new row.The Pressure Sensitive Log Analysis module also displays the configuration of the PSURP hardware when the experiment was run, e.g. button pressure thresholds that produce a keystroke.
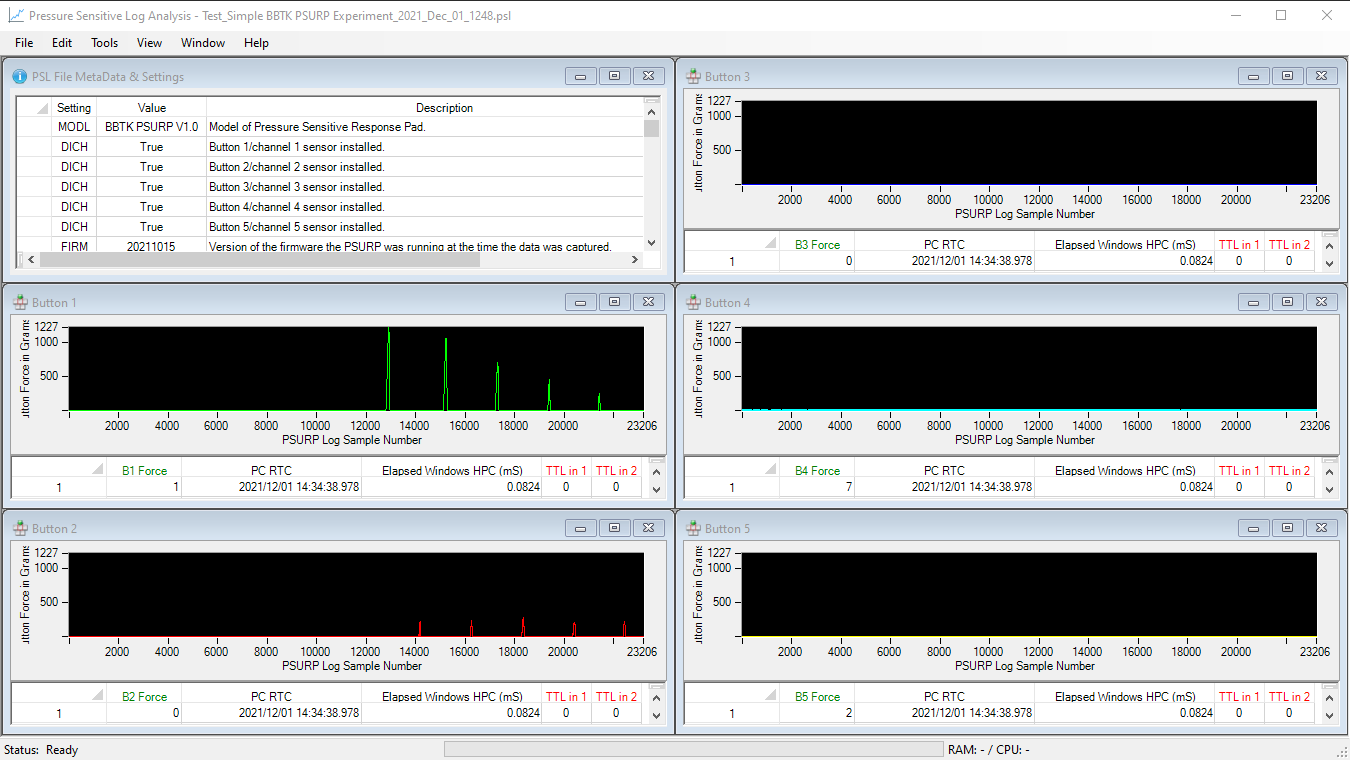
Above all the App is designed to be intuitive, quick and easy to use.
Step 3: Time locking individual responses from your experiment to force curves recorded by the pressure sensitive force activated USB response pad
To Time Lock the RTs and trials your experiment recorded to the PSURP pressure and force curves recorded by the partner App you need to load two files. One is from your experiment and one if from the PSRUP. Once loaded the two can be automatically Time Locked together for more detailed analysis.Your experiment should have recorded its own CSV file with each trial on a separate row as per the example from PsychoPy shown below when loaded into the Timelock Experiment Data to PSURP Log File module (top spreadsheet view). The critical measures in this file should be the time the first USB keystroke was detected as being down, i.e. a pre-set force threshold was surpassed and the time all keys were released and the next trial was moved onto.
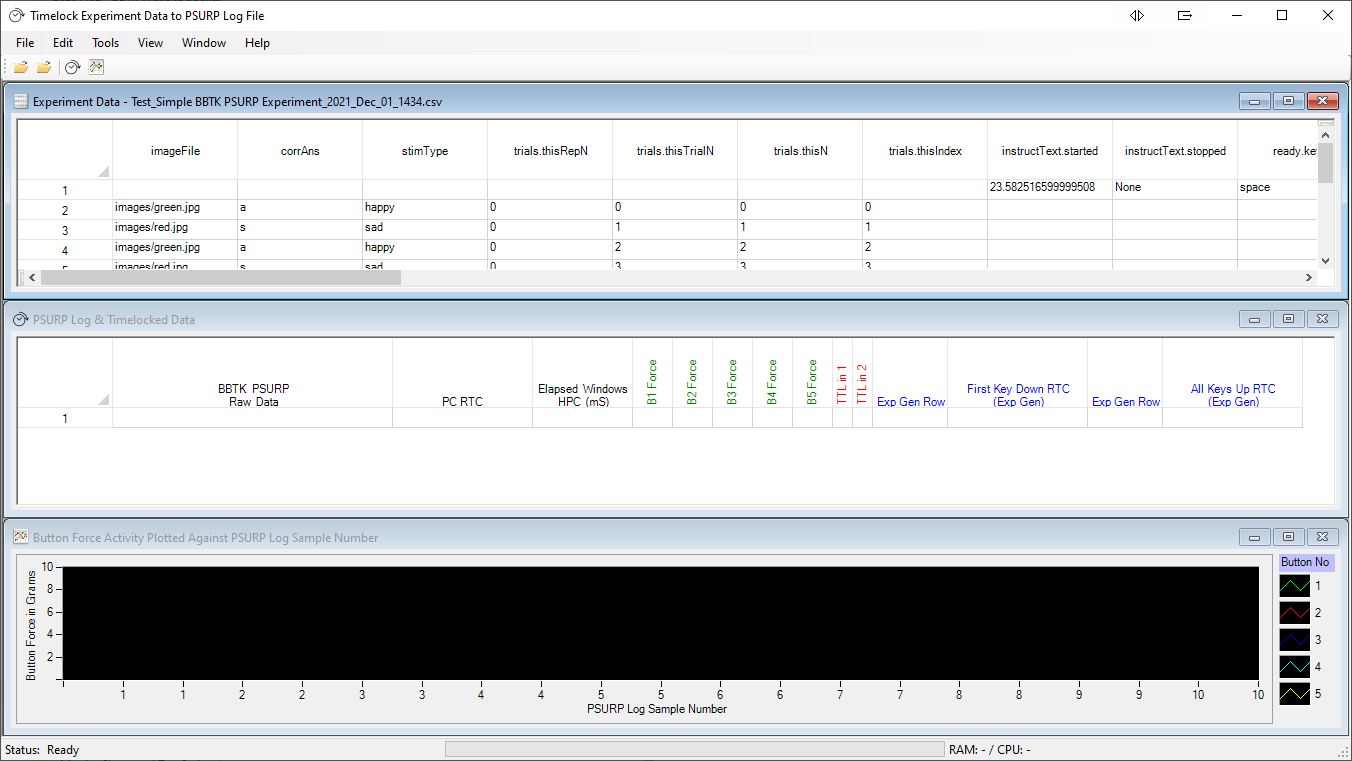
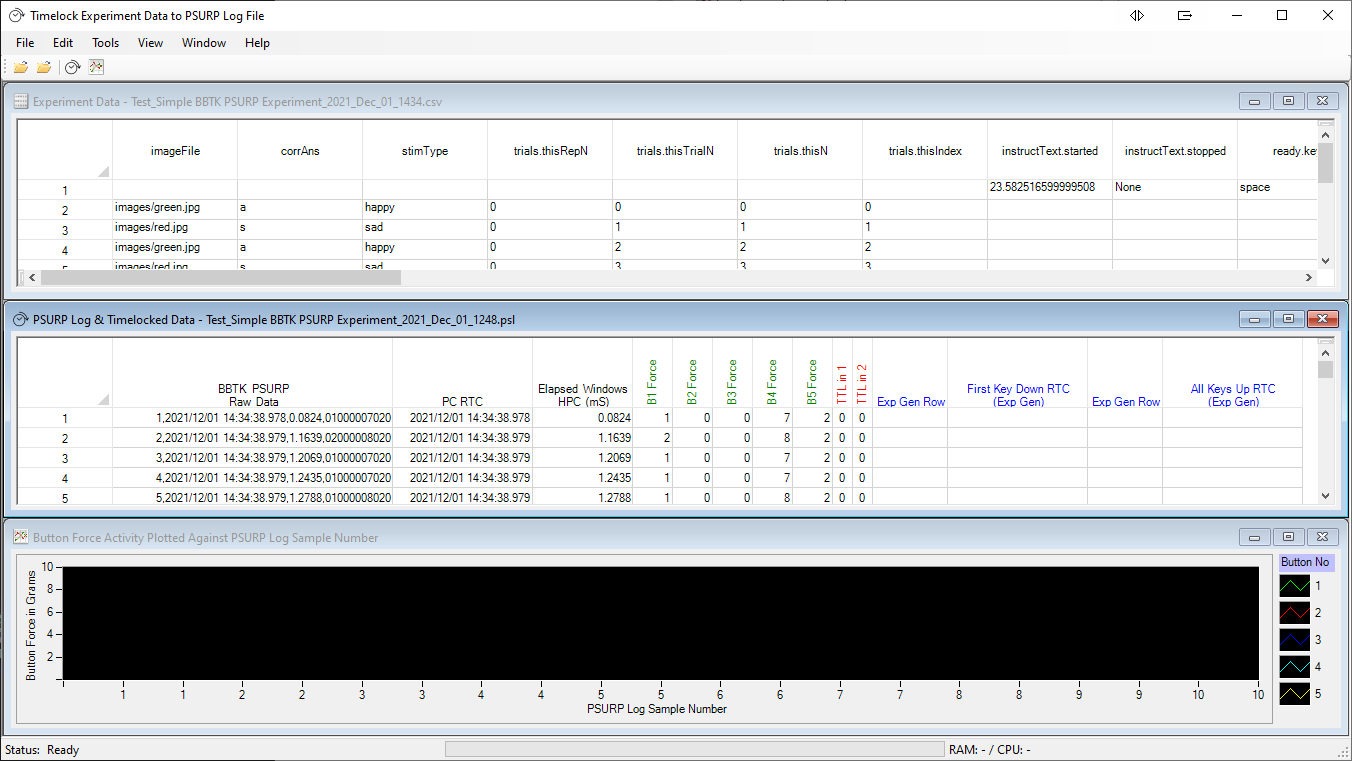
Next you would load the Pressure Sensitive Log file (.PSL file) which recorded all the actual button presses and forces that were streamed from the PSURP as the experiment was run. This is loaded into the middle spreadsheet view.
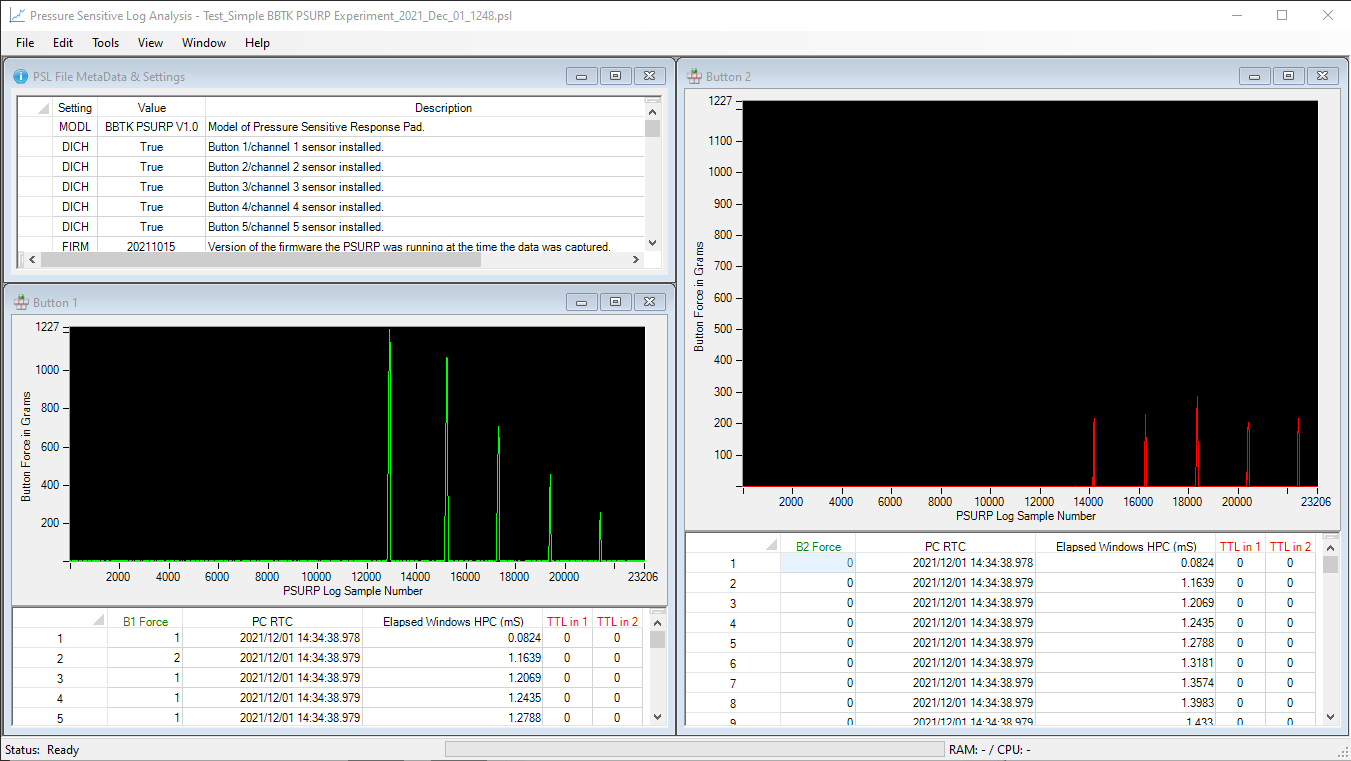
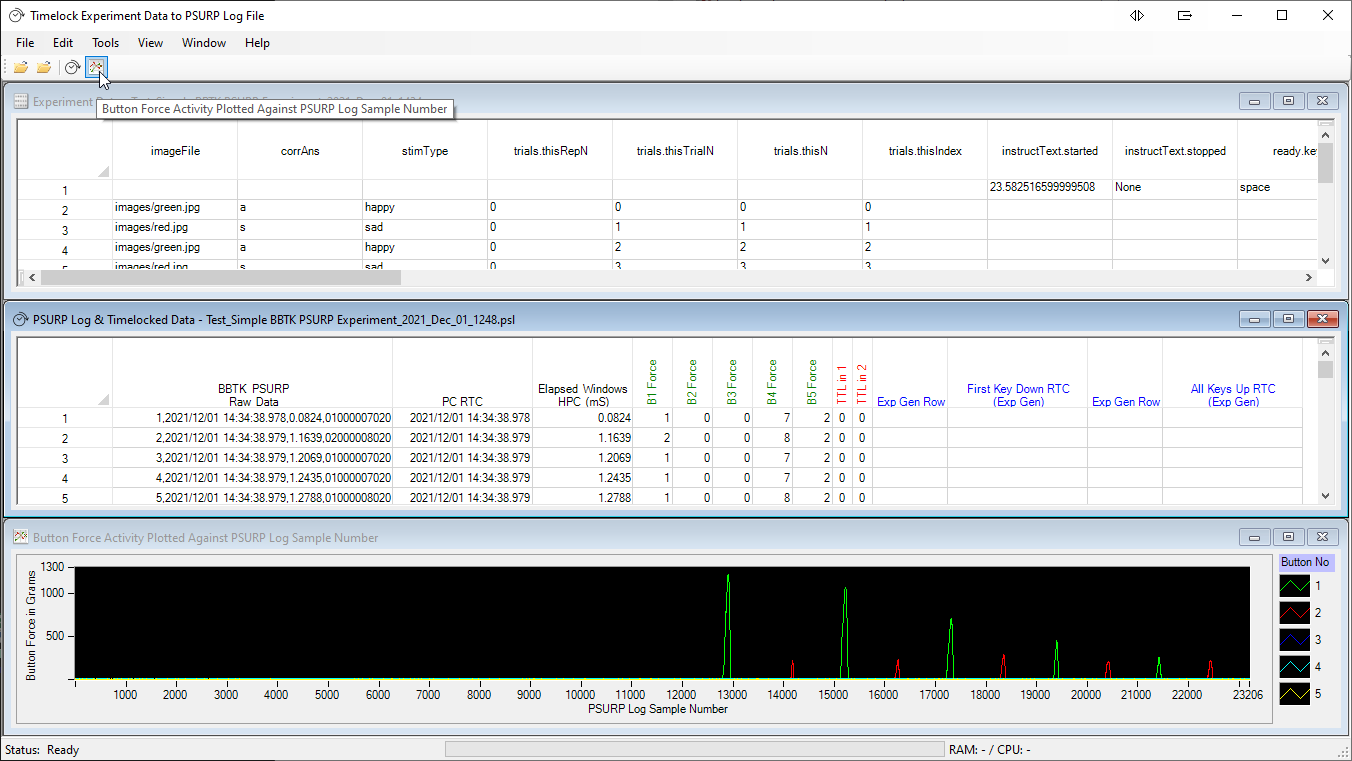
Before Time Locking the two files together it�s often useful to plot the force curves for each button by sample number/sampling rate, i.e. 400Hz. Here we can see the force curves for the two buttons. Green for button 1 and red for button 2. Remember the experimental task was to press button 1 (green) in response to a green smiley face and button 2 (red) in response to a red sad face. To do this simply click on the toolbar plot icon.
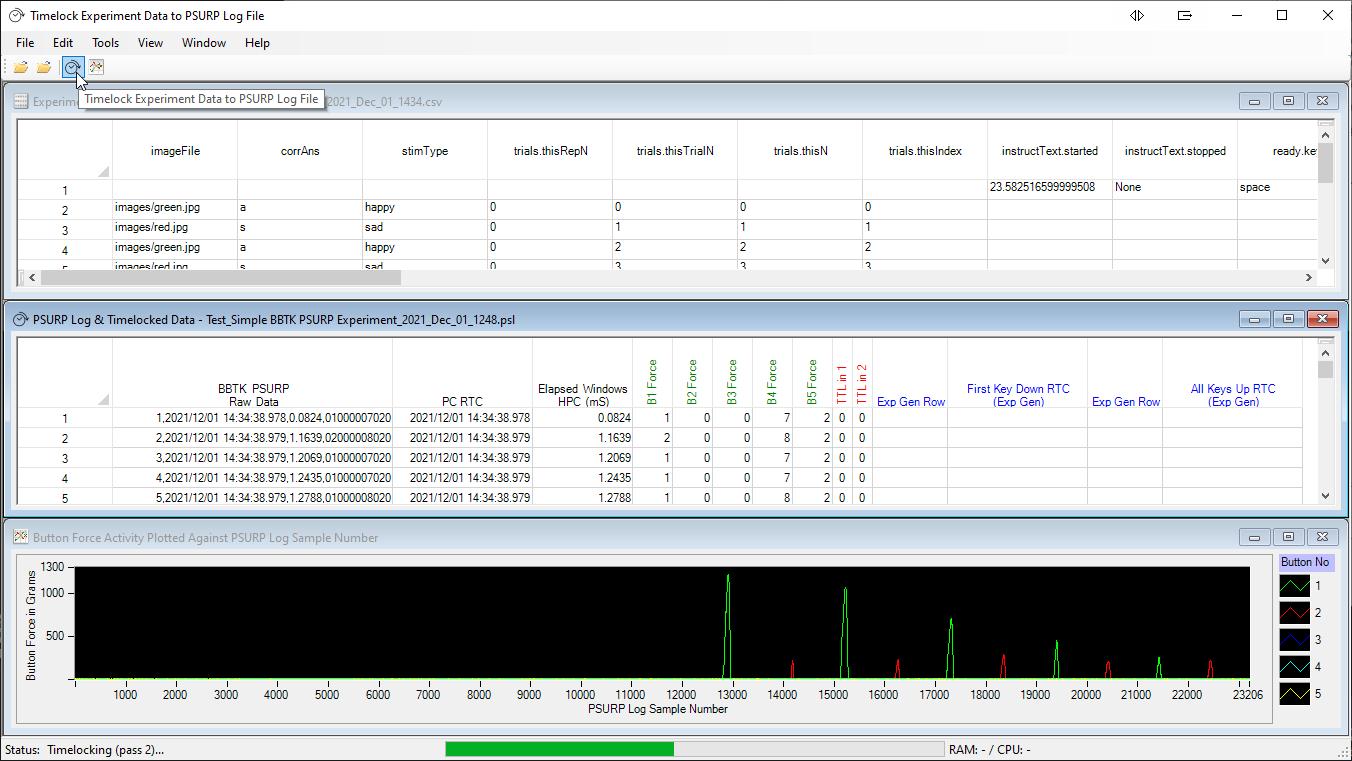
Using our inbuilt AI each trial from your experiment will be Time Locked and matched to the sample in the Pressure Sensitive Log file. Locking is based on the Real Time Clock timestamped in the experiment data file and the PSL file. To do this simply click on the toolbar Time Lock icon.
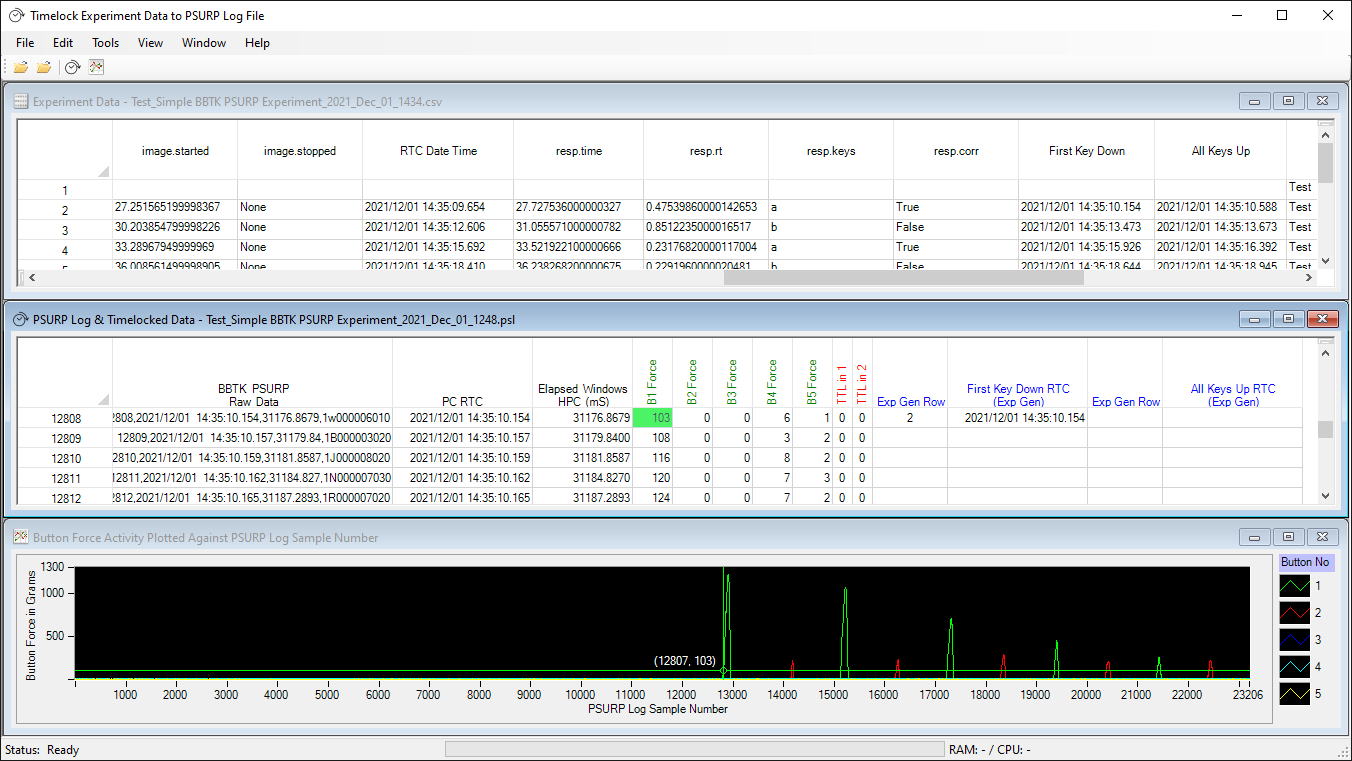
Once Time Locking is complete press F6 to move to the first trial. Here we can see that the response keystroke �a� was pressed on trial 1 (top experiment spreadsheet view row 2). We can also see that the force applied to the button at that time was 103 grams or 1.0100 Newtons. To make analysis even easier if you double click on the B1 Force cell in question it will turn green and moveable cursors will appear on the plot. The moveable cursors allow you to scroll back to see when the force curve started as the button was pressed initially. This for example would help you examine precuing effects.
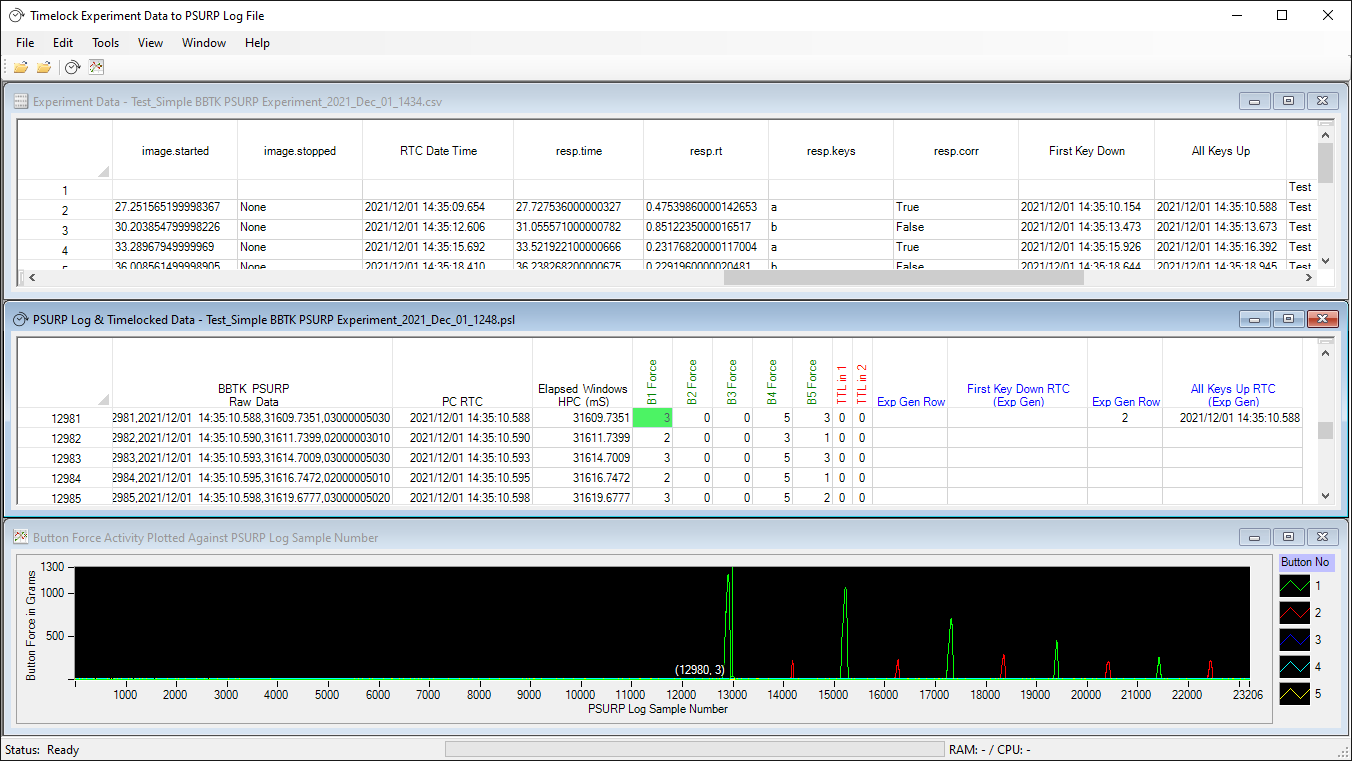
Pressing F8 on the other hand would let you jump to the first All Keys Up event and the recorded button force on the curve. This is the point where all USB keystrokes were flagged as being released in the experiment. Again we can highlight the button force at that time, i.e. 3 g or 0.0294 N. That point on the plot is highlighted by moveable cursors to enable further analysis of the force curve.
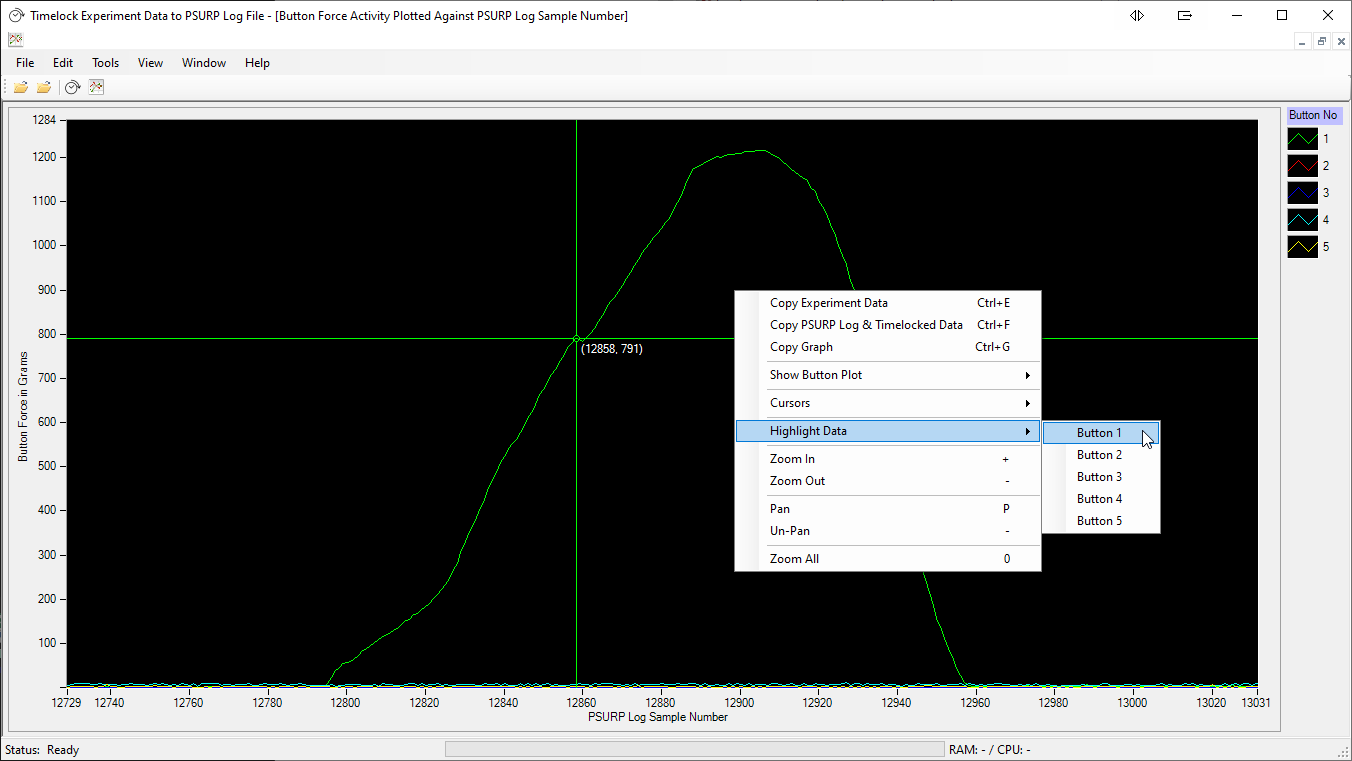
You can use the plot to zoom in to any given response force curve and use the moveable cursors to select and then automatically highlight data in the PSL spreadsheet view to help with detailed analysis.
Step 4: Exporting data for further analysis in MATLAB or Excel
Exporting spreadsheet view data for analysis in packages such as MATLAB or Excel is easily accomplished from the File | Export menu. Alternatively you can copy and paste from the spreadsheets or graphs. Both TAB and XLSX files can be read by most scientific software and they are straightforward to manipulate with your own scripts and code.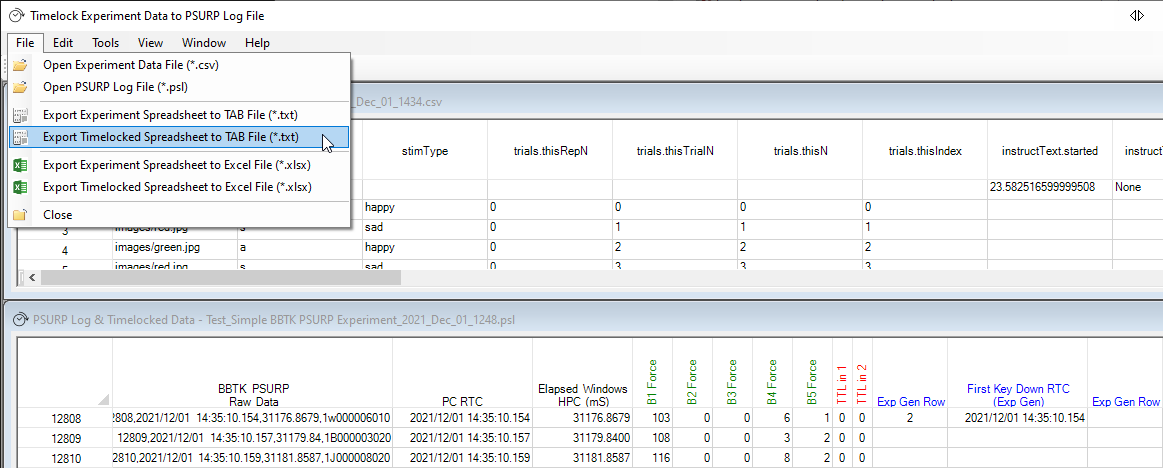
What does my experiment need to record and how?
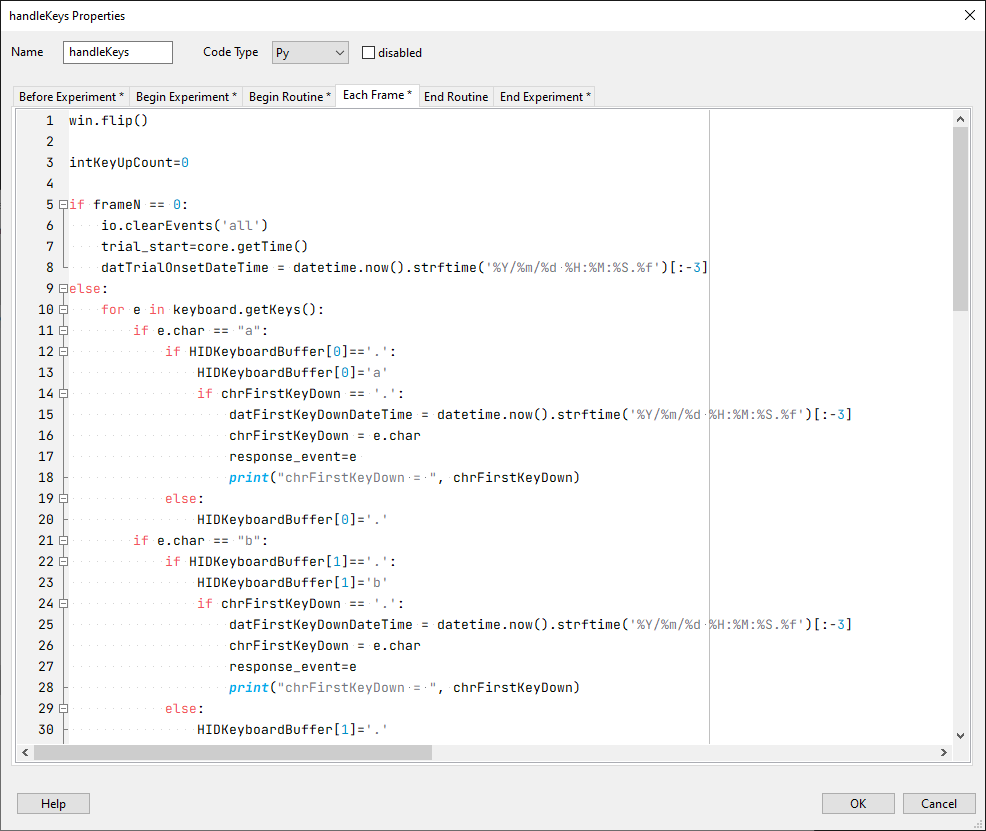
We provide example scripts and code snippets for many of the popular experiment generators, e.g. PsychoPy in this example. Even if you are not familiar with PsychoPy the rationale is very similar for any experiment generator or software which you have written yourself.In the example below you can see how each stimulus image is presented and there is some script to handle USB keyboard key presses and timestamp when a key was pressed and released.
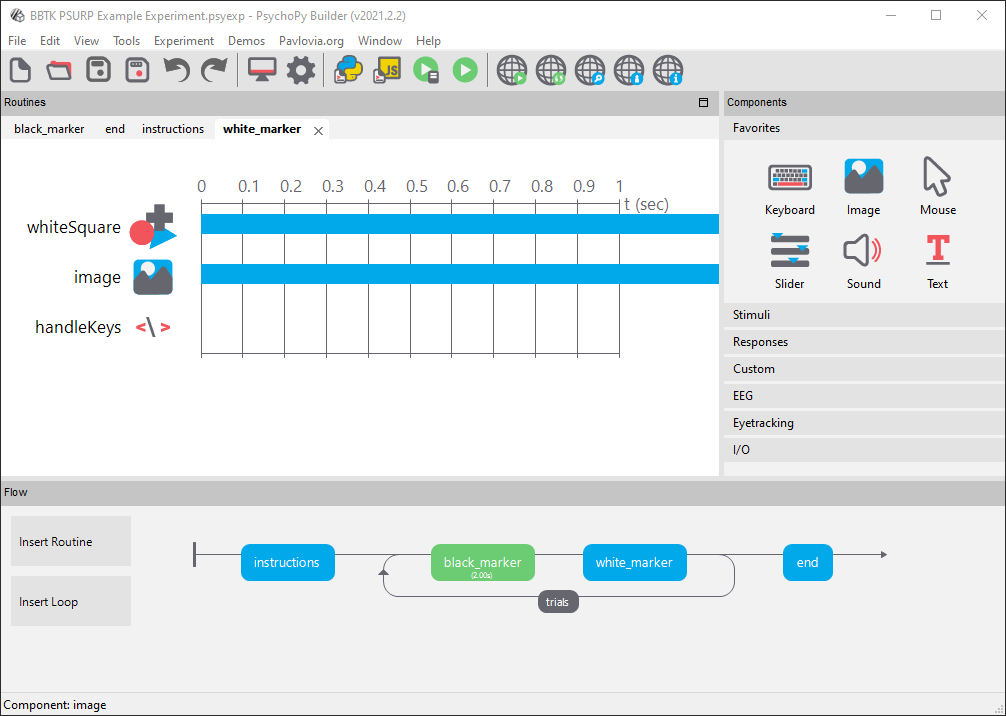
The actual script simply records the time which the keystroke was detected as being pressed. In PsychoPy this is written into a CSV file after each trial is completed. All the script does is record the timestamp and key in the normal PsychoPy format and methodology. In short there is no added complexity.
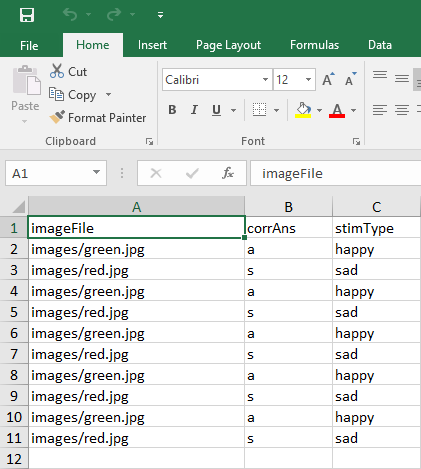
The standard trial format Excel file is used for defining trials in stimulus materials in PsychoPy. Below we can see how the image files to display per trial are shown on each row (imageFile) along with the correct answer (corrAns) and stimulus type for data coding (stimType), i.e. happy green face or sad red face.
Going further and live streaming force data into your own experiments
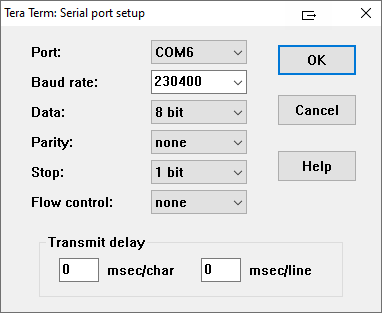
Although the BBTK PSURP partner App makes capturing and storing force curves a breeze, advanced users might prefer to read the streamed data directly, e.g. if they want to provide live feedback to participants. Remember though to keep it simple you can still accept keyboard keystrokes if you wanted.For the more technically minded the PSURP streams data over a Virtual USB COM Port, AKA a serial port, at a 230,400 Baud rate. Serial is a widely implemented industry standard communications protocol and is easily understood.
 |
 |
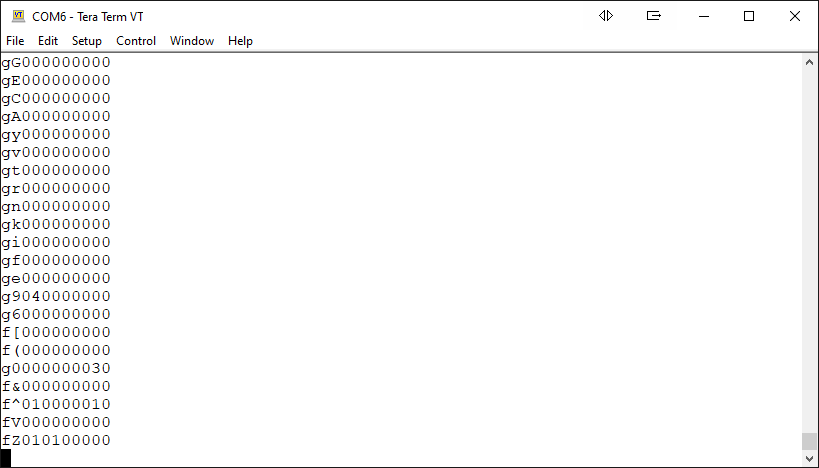
11 bytes of data are sent every 2.5 mS which gives a sampling rate of 400 Hz. The first 10 bytes, or characters, are pairs of force values in grams for each of up to five buttons. The last byte to the right is the status of the two TTL input event marking lines. These event marking, or trigger input lines, might be from Opto-detectors, Mic or your own equipment.
Each button force is encoded in base 71 to allow for more data in each byte pair. This means you will need to convert it to base 10 before reading off the force value in grams.
So to take the first example force data above, i.e. gG 000000000:
- gG is the raw force value for button1
- 00 00 00 00 afterwards means that buttons 2 to 5 are not pressed
- 0 the final zero means that there are no TTL input event markers or triggers
| 0 = 0 1 = 1 2 = 2 3 = 3 4 = 4 5 = 5 6 = 6 7 = 7 8 = 8 9 = 9 10 = a |
11 = b 12 = c 13 = d 14 = e 15 = f 16 = g 17 = h 18 = i 19 = j 20 = k |
21 = l 22 = m 23 = n 24 = o 25 = p 26 = q 27 = r 28 = s 29 = t 30 = u |
31 = v 32 = w 33 = x 34 = y 35 = z 36 = A 37 = B 38 = C 39 = D 40 = E |
41 = F 42 = G 43 = H 44 = I 45 = J 46 = K 47 = L 48 = M 49 = N 50 = O |
51 = P 52 = Q 53 = R 54 = S 55 = T 56 = U 57 = V 58 = W 59 = X 60 = Y |
61 = Z 62 = ! 63 = $ 64 = % 65 = ^ 66 = & 67 = * 68 = ( 69 = ) 70 = [ |
To do this simply take the first byte, i.e. �g� and look-up on the chart above. This gives a decimal value of 16. Next multiply this by 71 to give, 16 * 71 = 1,136. Next take the second byte �G� which gives 42 in decimal (no multiplication for the second byte). Then finally add the decimal values of the two bytes together to give the force in grams:
So gG 000000000 decodes as:
- g = 16 * 71 = 1,136
- G = 42
- Force = 1,136 + 42 = 1,178 g
- 1,178 g * 0.0098 = 11.5444 N
| Value of last byte | TTL in 1 | TTL in 2 |
|---|---|---|
| 0 | Off (0V) | Off (0V) |
| 1 | On (+5V input) | Off (0V) |
| 2 | Off (0V) | On (+5V input) |
| 3 | On (+5V input) | On (+5V input) |
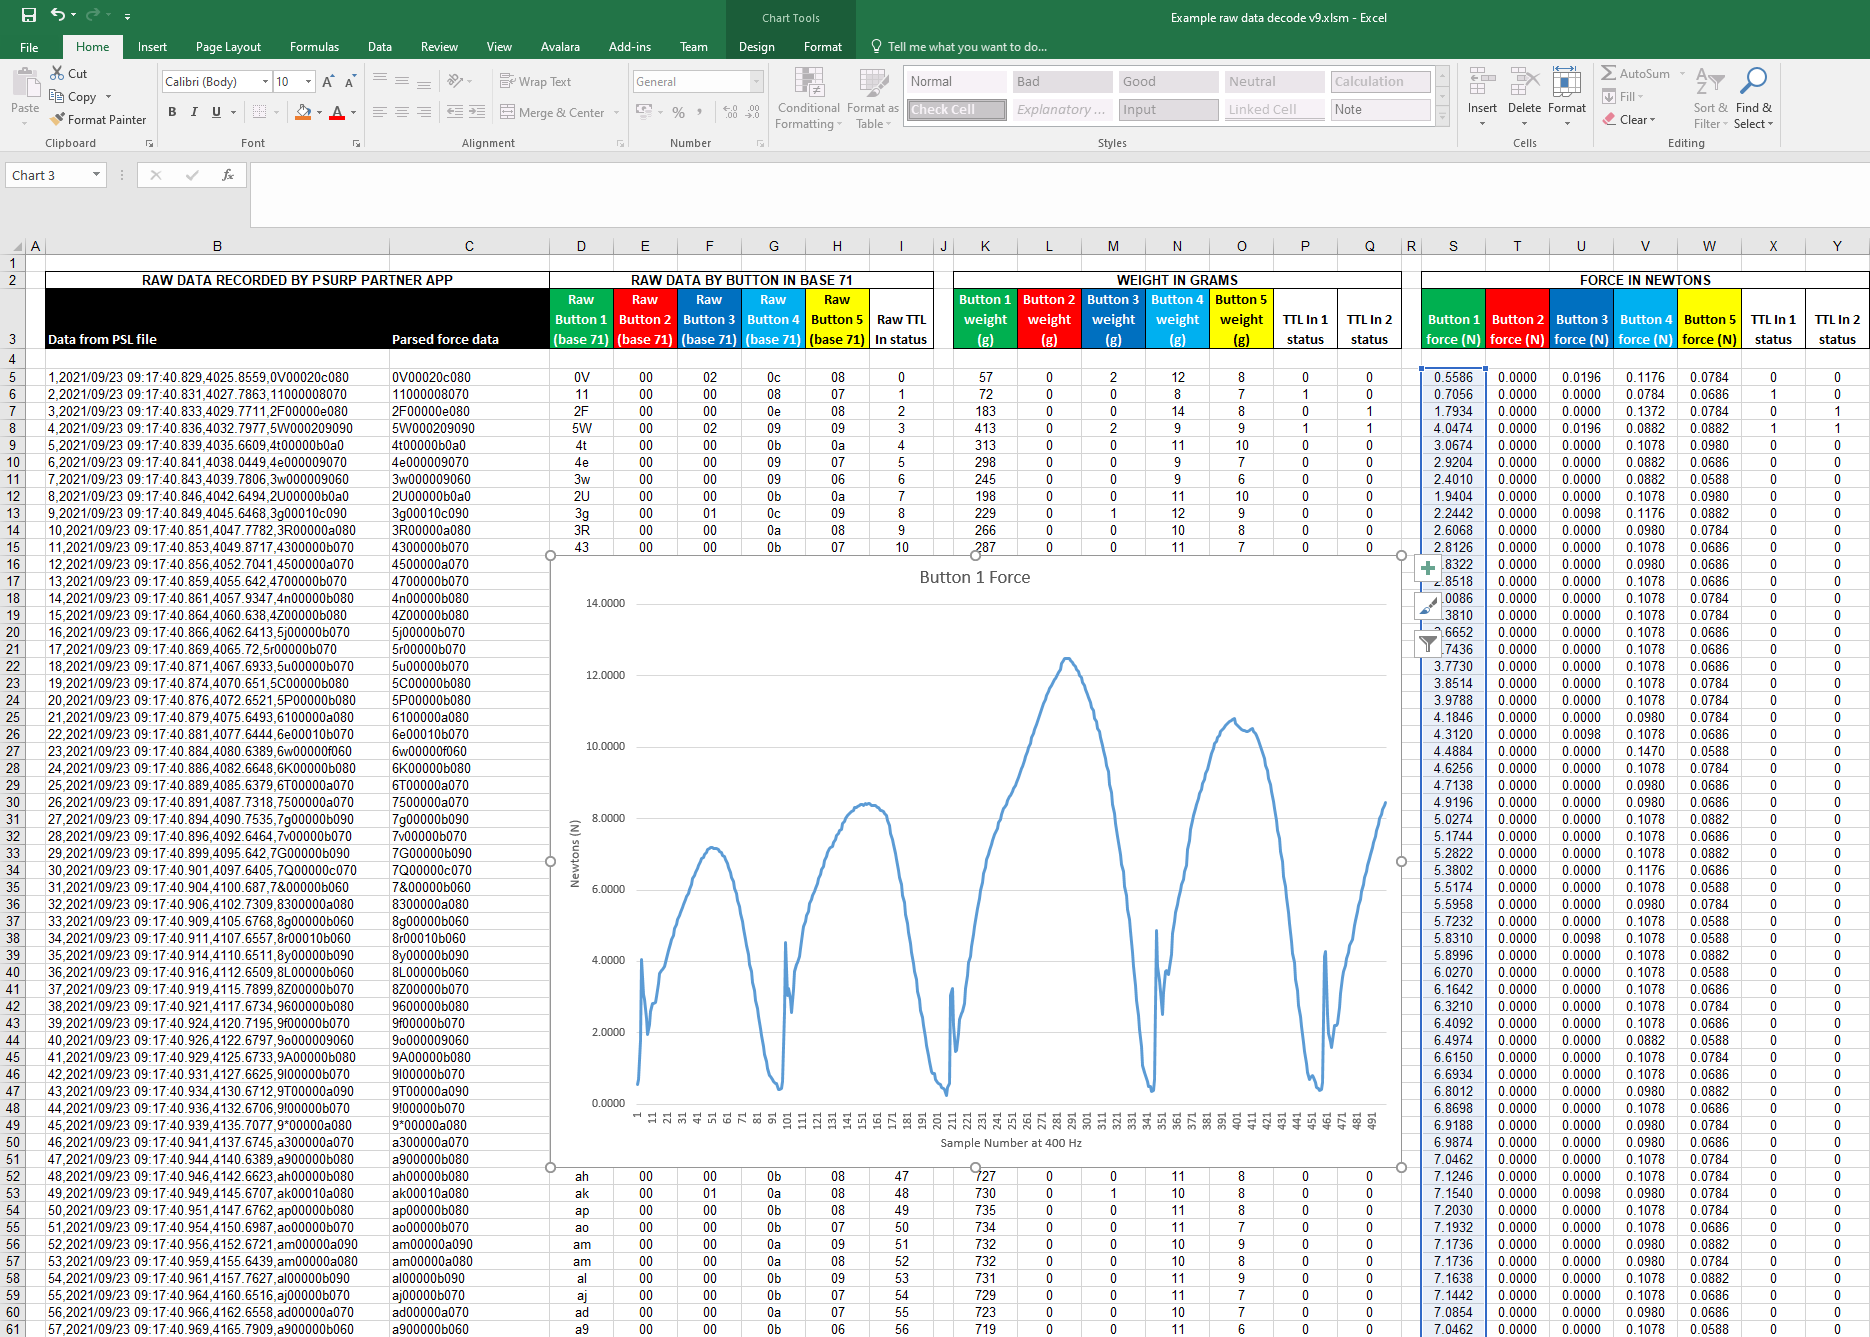
We provide an Excel spreadsheet that lets you decode the PSL files (Pressure Sensitive Log) which our PSURP partner App captures when it records force curves for each button press. This helps you check raw data and also write scripts which can decode live streamed data or data captured to a file of your own.
In addition we provide code snippets which you can integrate with your own scripts for on-the-fly force feedback to participants.
Full documentation is provided in order to access the API which is used to control the PSURP using simple four character serial commands. This means that you can also access the PSURP from a Mac or Linux system as well as a Windows system should you so wish. Remember our PSURP partner App described above is only available on MS Windows platforms.
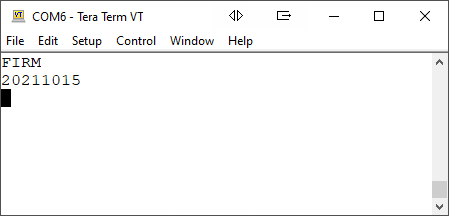
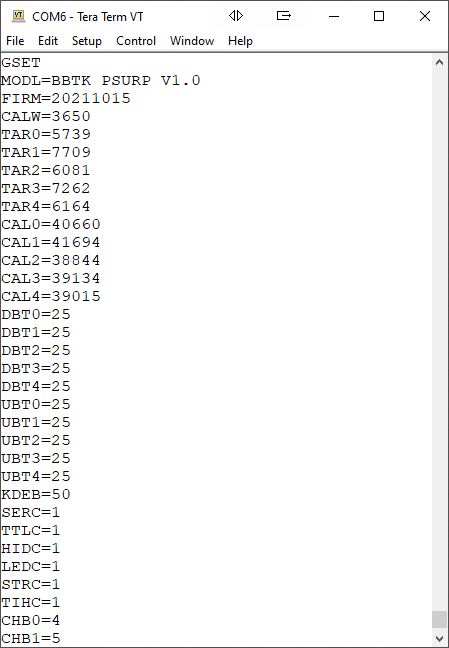
For example to get the firmware version you would simply send FIRM in a terminal window or over serial. To get all settings you would send GEST.
 |
 |
Changing settings, saving them as power on defaults or starting or stopping streaming of force data is easily accomplished using simple serial commands:
|
|
BBT0 10 |
|
SAVE | |
|
RUNE | |
|
X |
If you are running your experiment on a MS Windows platform however, remember our PSURP partner App does all this for you with a easy to use graphical interface.