Using The mBlack Box ToolKit v2 (event marking version): Worked examples
 A
wide variety of researchers need to TTL event mark/produce TTL
triggers with sub-millisecond accuracy during their research, e.g.
neuroscientists, cognitive psychologists, vision researchers etc.
A
wide variety of researchers need to TTL event mark/produce TTL
triggers with sub-millisecond accuracy during their research, e.g.
neuroscientists, cognitive psychologists, vision researchers etc.We appreciate that many may have used the basic inbuilt event marking functionality provided by their experiment generator or even made use of simplistic external hardware. The mBBTK v2 on the other hand is designed to do much more whilst at the same time being quick and easy to use. For example, it can live event mark on up to 48x inputs and sensors in real time and simultaneously record all timings for analysis at a later date.
Worked examples
Shown below are a set of worked examples illustrating how to use the mBBTK v2 for event marking. They are intended to give you a flavor of how the mBBTK v2 could work for you and how easy it is to use. Remember you also have the option to control it wirelessly via Bluetooth or to run it independently of a PC using one of 10 onboard profiles. Any of the examples shown below can simply be saved to one of 10 slots in the mBBTK v2's own RAM and run without a PC present!Worked Example 1: Simple Visual Stimulus Event Marking
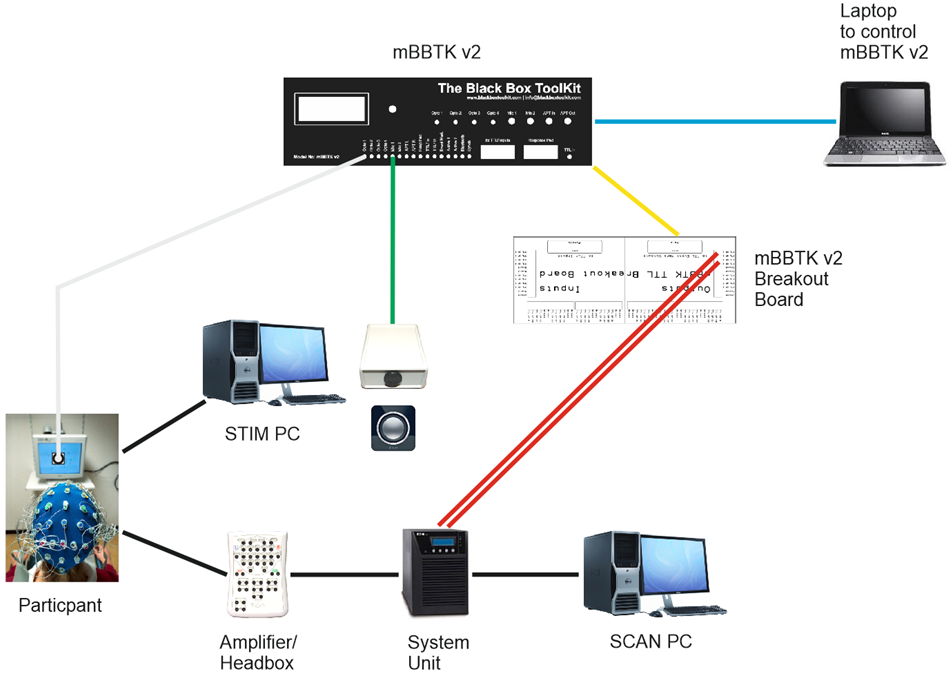
The simplest form of Event Marking is when a single visual stimulus is paired with a single TTL Event Mark/TTL trigger. When the stimulus is shown a +5V signal will be sent to the EEG System Unit for the duration of that stimulus. The leading edge of the Event Mark is the onset and the trailing edge is the offset of the stimulus. The duration of the stimulus image will appear as a digital Event Mark on the special Event Marking Trigger Input channels of the EEG software.The schematic below shows how a single mBBTK v2 Opto is placed on screen (grey line) and how from the breakout board (yellow) an Event Marking line, or cable, is connected to the EEG System Unit (red) so that the +5V TTL signal will appear on the STIM TTL Trigger Input port and ultimately on the EEG Event Marking channels.
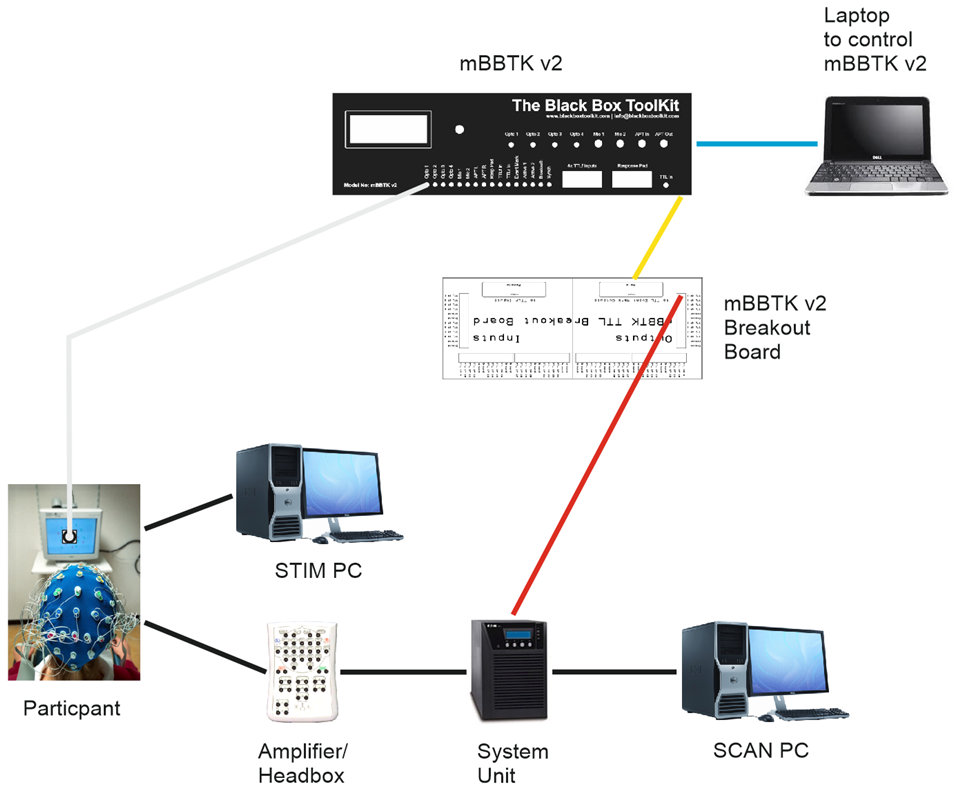
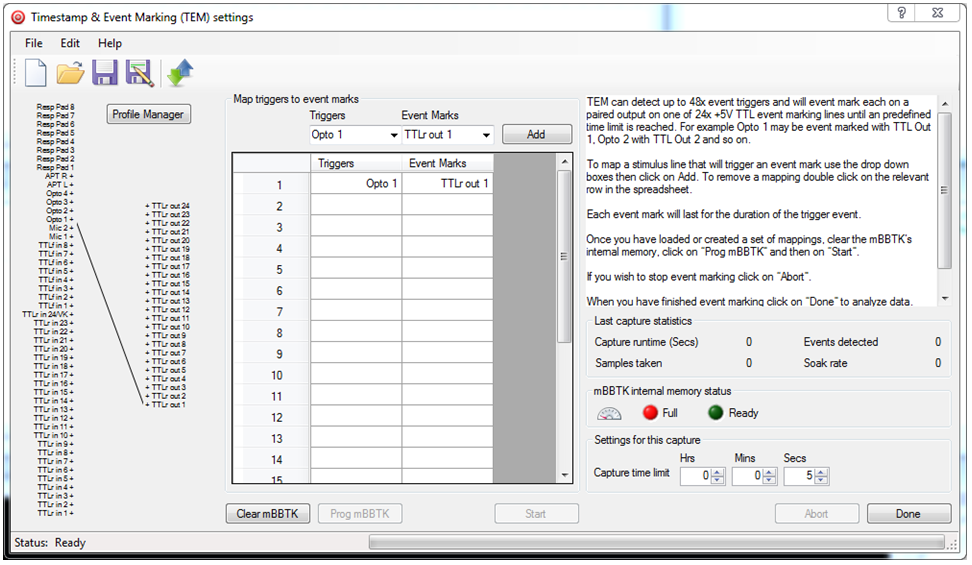
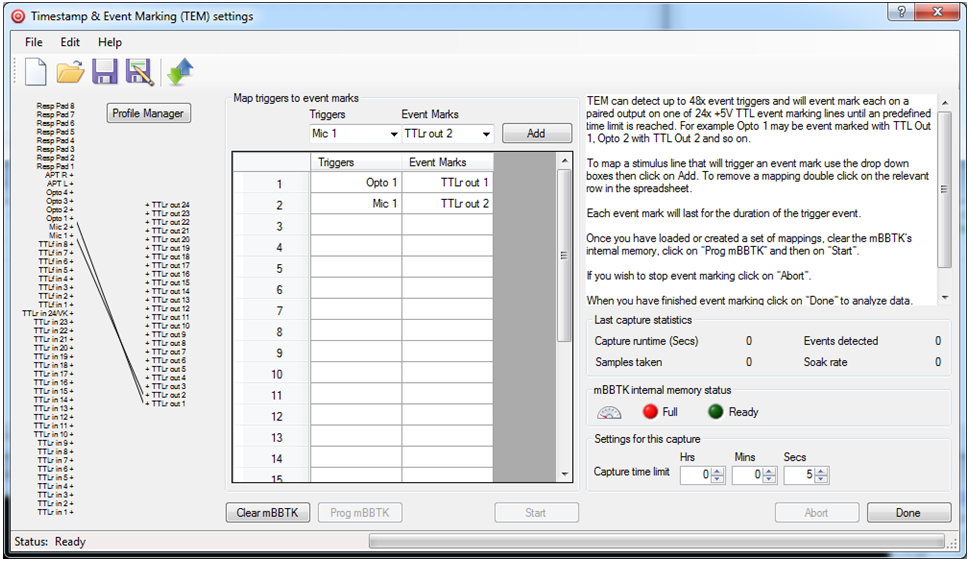
In this example the mBBTK v2 is controlled from a laptop via USB (blue). In the PC Software the Timestamp & Event Marking (TEM) settings would look similar to those shown below. Here Opto 1 has been paired with TTLr out 1 so that each time there is a visual stimulus a 5V TTL signal/TTL trigger will be present for the duration the stimulus is on screen. In this example timing data is only captured and recorded for 5 seconds. In a real study you would enter the minimum duration of your experiment.
Worked Example 2: More Complex Stimulus Event Marking
More complex Event Marking scenarios can be built up by adding more sensors and paring them to more TTL Event Marking lines/TTL triggers.In the example below a mBBTK v2 Microphone (green) will TTL Event Mark each time a sound is played through the STIM PC speaker to a participant. Note how two TTL Event Marking lines/TTL triggers are connected to the System Units STIM Trigger Input port, i.e. one to Event Mark each visual event and one to Event Mark each auditory event.
In this example the mBBTK v2 is controlled from a laptop via USB (blue). In the PC Software the Timestamp & Event Marking (TEM) settings would look similar to those shown below. Here Opto 1 has been paired with TTLr out 1 so that each time there is a visual stimulus a 5V TTL signal will be present for the duration the stimulus is on screen. Next Mic1 has been paired with TTLr out 2 so that when there is a sound a 5V TTL signal will be present for the duration of the sound. Ultimately unique Event Marks for each visual and auditory stimulus will appear on the EEG trace.
One can quite easily envisage how more sensors can be linked to more Event Marking TTL lines/TTL triggers, e.g. up to four optos and two microphones could be used.
Worked Example 3: Stimulus Event Marking Combined with an External Start or Sync Signal and a BBTK USB Response Pad
Building on earlier examples where both visual and auditory stimuli were Event Marked it is possible to add in start or sync signals from external equipment. It is also possible to add a Carbon Fibre Effect BBTK USB Response Pad to your study to ensure accurate event marking and timing of individual responses.The BBTK USB Response Pad functions as a second USB keyboard as far as your Experiment Generator is concerned (purple USB connection below). When you press a response button, or vocalise a response using the Voice Key model, a keystroke is sent to your STIM PC as though a key on a normal keyboard had been pressed. Thus all you need do is set your experiment up to accept standard keystrokes.
At the same time any response button is pressed, or Voice Key activated, a unique TTL signal/TTL trigger is generated together with the keystroke. Using a 9-way lead from the BBTK USB Response Pad these TTL signals can be fed into the front TTL input port of the mBBTK marked 8x TTLf Inputs (brown 9-way below). These can be paired, or mapped, to any Event Mark output together with any other TTL or sensor inputs.
Note that four additional TTL Event Marking lines/TTL triggers have been added (red) to mark each response pad button. This gives a total of seven Event Marking lines reflecting TTL start or sync signal inputs from STIM, visual and auditory stimuli and four response pad buttons. The BBTK USB Response Pad actually supports up to 8x buttons and a Voice Key (each of which can be independently event marked).
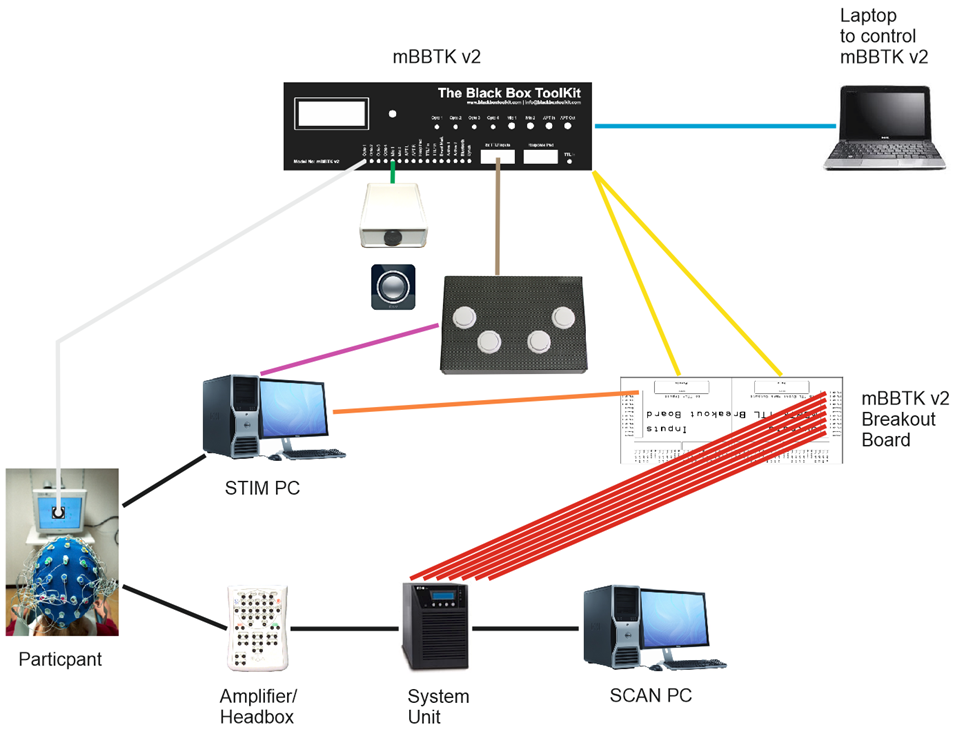
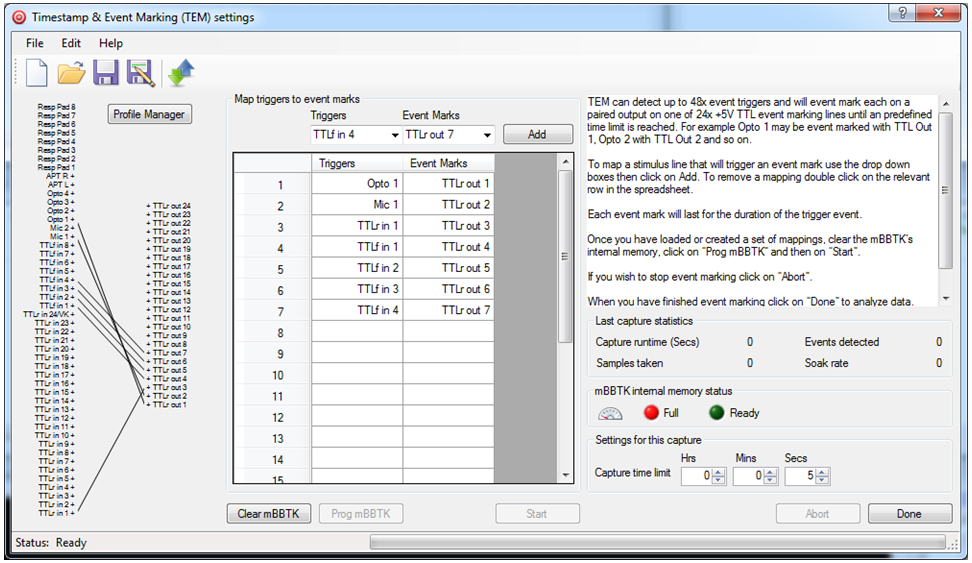
In this example a visual stimulus is linked to Event Mark TTLr out 1, an auditory stimulus to TTLr out 2, a TTL start or sync signal from STIM from TTLr in 1 to TTLr out 3. The four USB Response Pad buttons are linked to front TTLf in's 1-4 and to TTLr out's 4, 5, 6, and 7 respectively.
In terms of the STIM Trigger Input port on your System Unit this means that there are seven wires connected to it. Therefore there will be up to seven independent TTL Event Marks/TTL triggers on the EEG Event Marking channels.
To sum up, when a start or sync signal from your STIM PC signals the start of the experiment, or a trial, there will be an Event Mark on TTLr out 3, when a visual presentation is made an Event Mark on TTLr out 1 and when an auditory stimulus is heard an Event Mark on TTLr out 2. When the left most button on the USB Response Pad is pressed for example, a keystroke A will be sent to your STIM PC and at the same time an Event Mark on TTLr out 4 will be made.
Depending on mBBTK model used the sub-millisecond timings for each one of these events will be independently recorded and a 5V TTL event mark/TTL trigger made on your EEG trace. Thus not only are Event Marks made in real-time but you can also analyze timings for any event after your EEG run. Post hoc timing and Event Mark analysis are completely independent of timings and Event Marks recorded by your EEG system which will operate on its own time base.
Worked Example 4: Simple Visual Stimulus Event Marking in Standalone Mode without Using a PC
Example 1 is perhaps the simplest Event Marking scenario one can envisage where a single Opto-dectector monitors and Event Marks each appearance of a visual stimulus on TTL out 1.All the previous examples assume that you have a PC or laptop connected at all times controlling the mBBTK v2's Event Marking duties and want to upload and analyze Event Marking timing data after your experiment has finished.
Remember that once programmed the mBBTK v2 actually runs completely independently of your control PC and only uploads timing data after a run. All timings are from the mBBTK v2's internal ARM chip and not from your control PC. This means that the mBBTK v2 can be used in standalone mode where up to 10 on board Event Marking profiles can be run directly from the mBBTK v2 without a control PC being connected. Running in this mode means that no timing data will be collected but that Event Marks are still made with sub-millisecond accuracy based on sensor/TTL input and any predefined pairings or mappings.
The Onboard Profile Manager (OPM) in our PC Software lets you store up to 10 on board profiles which can be run independently of a PC by scrolling through them and selecting one to run using the LCD and knob on the front of the mBBTK v2. These on board profiles can be as simple, or as complicated, as you need them to be. Once downloaded to the mBBTK v2 profiles are stored in Non-Volatile RAM (NVR) so that they can be recalled at any time regardless of how long the mBBTK v2 has been left turned off.
Before you can use an on board profile they need to be created in the Timestamp & Event Marking (TEM) module and transferred to the mBBTK using the Onboard Profile Manager (OPM) as shown below.
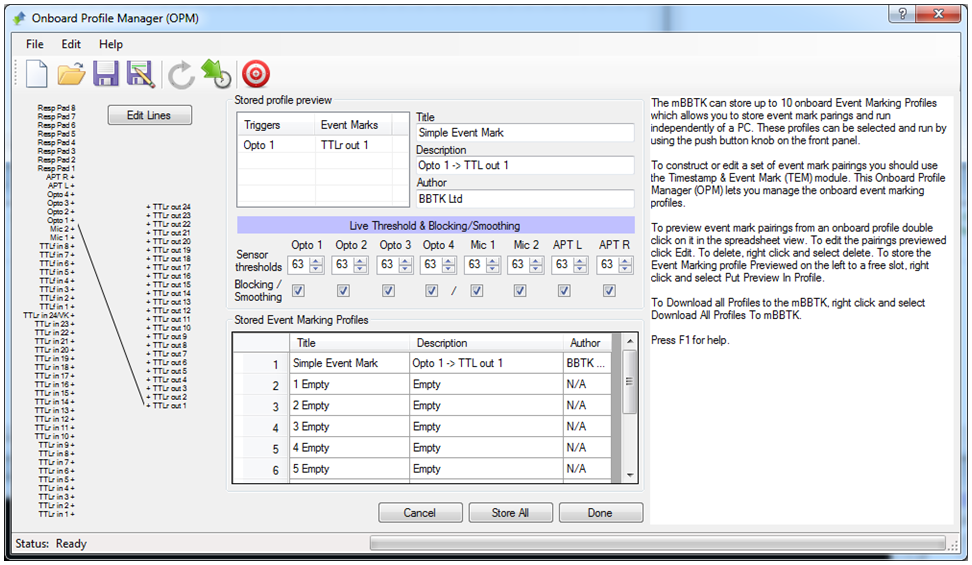
Here the simple Event Marking profile outlined in Example 1 has been downloaded to the mBBTK v2. When you switch the mBBTK v2 on without a control PC connected you will be able to press the button on the front and scroll through a list of on board profiles by turning the knob left or right.
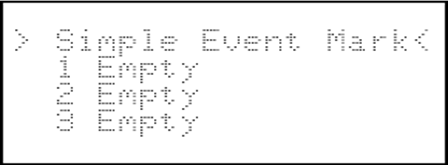 |
Here
the first profile is the one in the example that was
downloaded from the OPM module. To run it simply rotate the knob to select it on the LCD and then press the button. |
When you run on board profiles such as the one outlined they will run autonomously forever until the button is pressed to stop the profile or the power is removed.
If the button is pressed to stop a running profile you will be returned to the main menu which then displays the list of 10 on board profiles.
Analyzing event marking data
Whilst live TTL event marking/TTL triggering any sensor changes, TTL inputs, response pad button presses etc. and outgoing event marks are logged with sub-millisecond accuracy. After an event marking run has finished this gives you the opportunity to replay and analyze all timing data so that any event can be compared with any other. Timing data is presented in both spreadsheet format and on a 20 Channel logic analyzer style plot with two measurement cursors. By using such advanced software alongside real time event marking this gives you the option to shift the the entire timing load from your PC on to the mBBTK v2 for vastly improved accuracy, e.g. to measure RT's relative to visual stimulus presentations and other event marks.Our simple to use event marking analysis software is shown below.
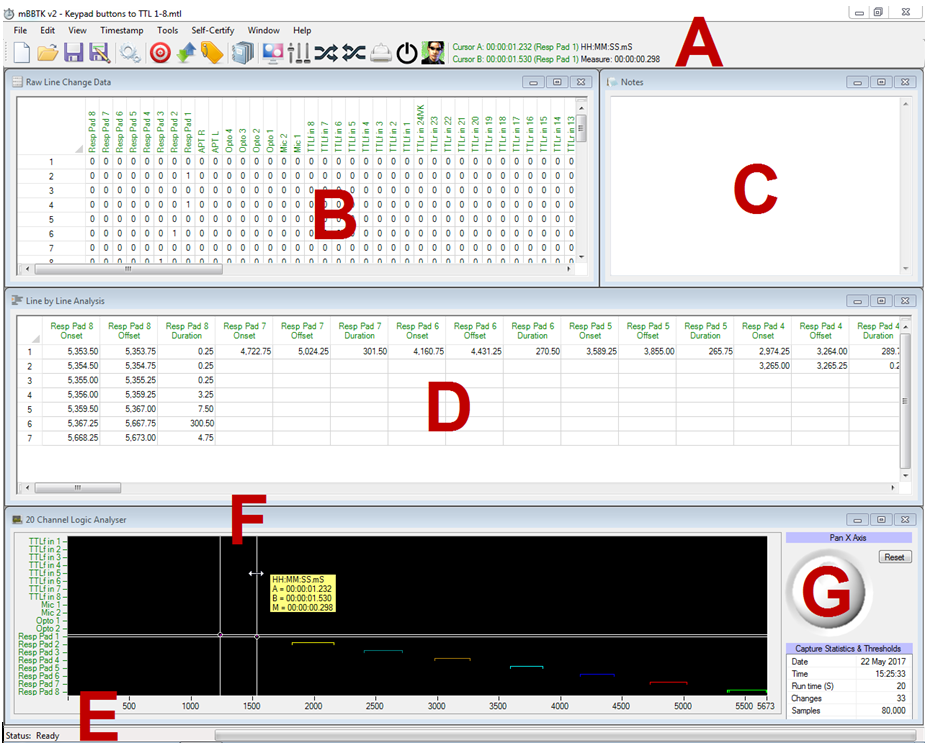
A Shows the menu bar and standard toolbar buttons. If you look at the menu items or hover over a button a shortcut key will be shown, e.g. CTRL+R for a summary report.
B Shows the raw data, i.e. the status of each line each time there was a change on any of the 48 mBBTK v2 input sensors or lines. Elapsed time and durations are shown in uS (microseconds or millionths of a second) and mS (milliseconds or thousandths of a second).
C Shows a simple notepad that can be used to make notes that are saved with the Marking Time Log (MTL) file.
D Shows the processed data. It shows the onset, offset and duration in mS (milliseconds) of each sensor or line. Note that a single sensor on period may appear as multiple line changes in B as other lines go on and off. Only in D can you get a clearer picture of what happened.
E Shows the status bar and progress indicator. For example, when longer captures are plotted on the Logic Analyser this will show which lines are being analysed.
F Shows a Logic Analyzer plot of the captured data (digital on and offs). Note the Logic Analyzer plot (F) is accurate to 1mS, whereas numerical data in both spreadsheets (B & D) is accurate to hundredths of a millisecond, i.e. two decimal places.
G Shows summary Capture Statistics & Thresholds. This provides details on capture date, time, runtime, number of line changes or events, samples taken, soak rate, sensor thresholds and whether the opto-detectors blocked together individual refreshes on a CRT or Mics and Audio Pass-Throughs were smoothed.